Step 1.4 Collect baseline data
Once the skill or behavior and activities or routines are identified, the team and family collect data on that skill or behavior within those activities or routines to determine how often the toddler uses the target skill or behavior if at all. Conducting a baseline clearly illustrates the toddler’s current performance level. If an accurate baseline is not established the EI team is unlikely to develop appropriate goals and criteria by which to measure progress. And further, the EI team is unlikely to be able to make the right adjustments to their and the family’s implementation of reinforcement and other evidence-based practice necessary to support the toddler and family’s success.
a) The EI team, with the family, measure the toddler’s use of the skill or
behavior by collecting the following data:
Frequency data
Frequency data measures how often the toddler engages in the skill/behavior. Data are collected through time sampling or event sampling.
Sampling: When using time sampling, data are collected after a certain amount of time has passed (e.g. every 5 minutes). For example, if collecting data on frequency of screaming behavior a parent or provider would mark if the behavior happened every 5 minutes. This technique is useful for behaviors the toddler engages in frequently such as for engagement and parallel play.
Event sampling: Event sampling is used by marking every time that the toddler engages in the behavior. This technique is used for low frequency behaviors or skills such as requesting help, playing specifically with a toy, helping put on clothes, and so on.
For Aiden, the team could take frequency data on the number of bites that he eats during a sitting.

Data: How frequently Jack requests for more snack during snack time by signing “more”, pointing to the food, or approximating the food (“cracker”).
The event sampling data shows that his use of requests increased across the four days that data was collected:
|
Date |
# of Requests |
Total |
|---|---|---|
|
9/18/2012 |
X |
1 |
|
9/18/2012 |
X |
1 |
|
9/19/2012 |
XXX |
3 |
|
9/20/2012 |
XXXX |
4 |
Duration data
Duration data are used to record the length of time that the toddler engages in the skill/behavior. For example, a parent or provider might collect data on how long a toddler sits at the table during dinner before demanding to be let down. A parent or provider might collect data on how long the toddler spends playing with one open-ended toy before moving on to something else.
Data: The length of time that Aiden sits at a table eating or playing
|
Date |
Start Time |
End Time |
Total Time |
Playing or Eating |
|---|---|---|---|---|
|
5/9 |
5:55 |
5:57 |
3 |
Playing with blocks |
|
5/10 |
5:55 |
5:59 |
4 |
Eating/playing with blocks |
|
5/11 |
5:43 |
5:45 |
2 |
Eating/playing with cars |
|
5/12 |
5:40 |
5:43 |
3 |
Playing with blocks |
Data: The length of time that a toddler spends in each bathroom's tub before demanding to be taken out.
Although the time in bath increased it’s not clear whether that is due to time or whether Caroline prefers the master bathroom.
|
Date |
Start Time |
End Time |
Total Time |
Bathroom Used |
|---|---|---|---|---|
|
7/4/12 |
7:18 |
7:21 |
3 |
Guest |
|
7/5/12 |
6:55 |
6:59 |
4 |
Guest |
|
7/7/12 |
7:02 |
7:07 |
5 |
Master |
|
7/8/12 |
7:22 |
7:24 |
6 |
Master |
b) EI team members collect baseline data for a minimum of four days or until a
trend is clear and stable before beginning implementation of reinforcement
A stable baseline helps the team know whether their use of reinforcement is impacting the toddler’s behavior. If the baseline is not stable, the team will not know whether it was their and the family’s implementation of negative reinforcement that produced a change in the toddler’s behavior or use of a skill.
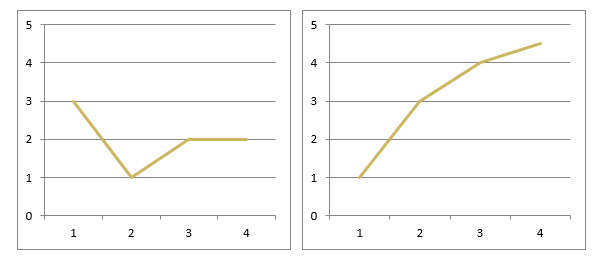
Baseline data should be graphed in order to best determine if a trend is stable such as in the following graphs. The graph below illustrates the number of times a day a toddler urinated in a potty across 4 days. In both of the graphs below a stable trend can be identified. While the graph on the left is more erratic, it is clear that the frequency or duration of the behavior is at the level of a 2 and that the level is overall flat. The graph on the right clearly slows an increasing trend. Generally, at least 3 data points are needed to begin to identify a trend.